
Page 14 - AeM_October_2020
P. 14
RESEARCH
ANALYSIS
TRENDS
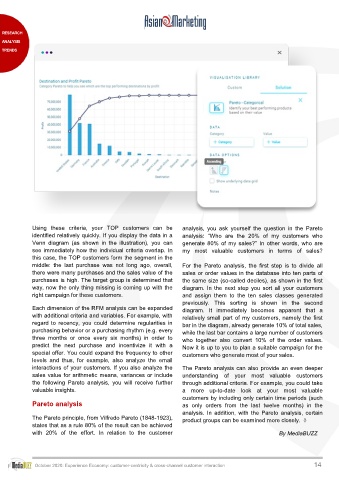
Using these criteria, your TOP customers can be analysis, you ask yourself the question in the Pareto
identified relatively quickly. If you display the data in a analysis: “Who are the 20% of my customers who
Venn diagram (as shown in the illustration), you can generate 80% of my sales?” In other words, who are
see immediately how the individual criteria overlap. In my most valuable customers in terms of sales?
this case, the TOP customers form the segment in the
middle: the last purchase was not long ago, overall, For the Pareto analysis, the first step is to divide all
there were many purchases and the sales value of the sales or order values in the database into ten parts of
purchases is high. The target group is determined that the same size (so-called deciles), as shown in the first
way, now the only thing missing is coming up with the diagram. In the next step you sort all your customers
right campaign for these customers. and assign them to the ten sales classes generated
previously. This sorting is shown in the second
Each dimension of the RFM analysis can be expanded diagram. It immediately becomes apparent that a
with additional criteria and variables. For example, with relatively small part of my customers, namely the first
regard to recency, you could determine regularities in bar in the diagram, already generate 10% of total sales,
purchasing behavior or a purchasing rhythm (e.g. every while the last bar contains a large number of customers
three months or once every six months) in order to who together also convert 10% of the order values.
predict the next purchase and incentivize it with a Now it is up to you to plan a suitable campaign for the
special offer. You could expand the frequency to other customers who generate most of your sales.
levels and thus, for example, also analyze the email
interactions of your customers. If you also analyze the The Pareto analysis can also provide an even deeper
sales value for arithmetic means, variances or include understanding of your most valuable customers
the following Pareto analysis, you will receive further through additional criteria. For example, you could take
valuable insights. a more up-to-date look at your most valuable
customers by including only certain time periods (such
Pareto analysis as only orders from the last twelve months) in the
analysis. In addition, with the Pareto analysis, certain
The Pareto principle, from Vilfredo Pareto (1848-1923), product groups can be examined more closely. ◊
states that as a rule 80% of the result can be achieved
with 20% of the effort. In relation to the customer By MediaBUZZ
October 2020: Experience Economy: customer-centricity & cross-channel customer interaction 14